How do I read the profiler

xyz Well, I hoped I wouldn't have to do that if I use the profiler. It did point me in the right direction at least, the problem was physics related. I use a somewhat complex mesh for the world and I had to check if an enemy is on the floor using test_move() instead of is_on_floor()(for reasons). Instead of doing that I added an Area3D and check if it has overlapping bodies, which seems to work just fine and the lag spikes are pretty much completely gone. Now I just need to figure out how I can make the world collision mesh simpler or split it into multiple parts, not sure if that will actually help though.

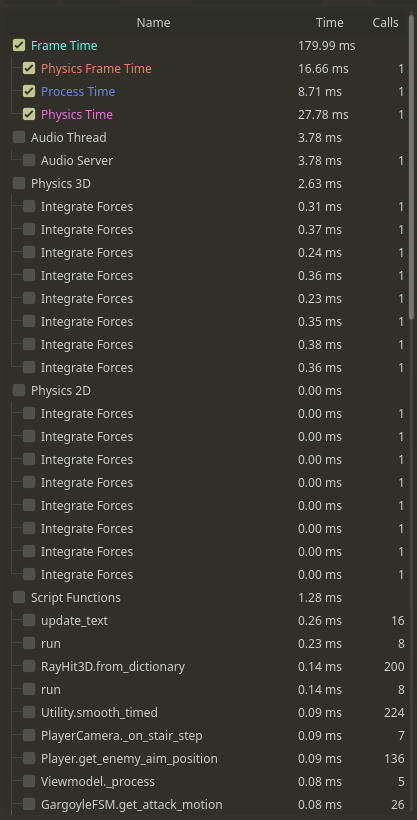
I have similar issue on Godot 4.3. Profiler shows lik 80ms on process time but all the other are like 0.02. Someone knows why this happens?
That's my issue. The scripts listed there don't sum up to even 2ms. and process says 30ms
- Edited
6monkey9 Then the native code is using a lot of processing time. Check your total node count, look for types of nodes that may need to handle a lot of data per frame. Hard to tell precisely without seeing the overall structure of the project and what the scripts are doing. Looking at the Monitors in the debugger may also give you some clues.
